- Messages
- 602
- Reaction score
- 687
- Points
- 103
part c help please
We are currently struggling to cover the operational costs of Xtremepapers, as a result we might have to shut this website down. Please donate if we have helped you and help make a difference in other students' lives!
Click here to Donate Now (View Announcement)
part c help please
its this paper i thinkWhice Paper is this?
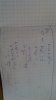
need to divide what the angle BOA is by 2
May you get good grades InshaAllah!! best of luckIs x-12/-5 the same to 12-x/5
May june 2008 paper2 question 17 and I would like to know how to approach such questions
Is there any good way to improve my perfomance while dealing graphs related questions any rules that would help plus what is a histogram? I mean a histogram at times is represented by height or by the bar area I am completely confused help is needed please
what do u mean by dealing with graphs? is it drawing them or reading them off?May june 2008 paper2 question 17 and I would like to know how to approach such questions
Is there any good way to improve my perfomance while dealing graphs related questions any rules that would help plus what is a histogram? I mean a histogram at times is represented by height or by the bar area I am completely confused help is needed please
what do u mean by dealing with graphs? is it drawing them or reading them off?
Histogram has bars. But bars with no space. And bar graph also has bars but with space. In Histograms on y-axis its frequency density and on x-axis the class intervals. And yea the area in each bar gives u the total frequency. Thus, histogram is represented by f.d on y-axis and class intervals on x-axis.
and f.d = frequency / class width.
so if u r given a graph u'll be given f.d and class width and will be told to find, maybe lets say, mean etc. So u'll need to use this formula to find frequency first.
u can post any specific question on histogram to make ur question more clear.
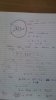
in cumulative frequency we add the previous frequency . the first frequency is written as it is in this question its 12, the next is 12+15=27, the next 27+23=50 and so on... the last one will always be the total number of frequencies, in this question it is 200....So what about cumulative frequency I don't how do we find it out in May June 2010 v 42 q7 part b and what is the difference between frequency and cumulative frequency are they the same or what?
have u done radians? have u done angle = s/r ?Paper 42 o/n 2012 q 4 part b (v) explanation needed
Sorry I didn't get you what do you mean? I just can't work out how to find the length of the archave u done radians? have u done angle = s/r ?
lol leave it what i saidSorry I didn't get you what do you mean? I just can't work out how to find the length of the arc
could post the solution so I could understand
hope u understand. if not ask anything.Sorry I didn't get you what do you mean? I just can't work out how to find the length of the arc
could post the solution so I could understand
i think i studied from those books in GCSE. is it the oxford ones?I want to know if anybody here is studying from Mathematics Syllabus D Book 1,2,3,4.
For almost 10 years, the site XtremePapers has been trying very hard to serve its users.
However, we are now struggling to cover its operational costs due to unforeseen circumstances. If we helped you in any way, kindly contribute and be the part of this effort. No act of kindness, no matter how small, is ever wasted.
Click here to Donate Now