• We need your support!

    We are currently struggling to cover the operational costs of Xtremepapers, as a result we might have to shut this website down. Please donate if we have helped you and help make a difference in other students' lives!
    Click here to Donate Now (View Announcement)

Physics: Post your doubts here!

Messages
75
Reaction score
48
Points
28
well thats actually a fact
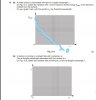
in the graph drawn in the book, iron is the most stable metal and it has 56 nucleons.
which paper is this btw?
june 2017 42. still dont know why we have to include the 56 and its worth one mark.....
56 is the nucleon number for iron both La and U-236 have a greater nucleon number. y include it in the answer
 
Messages
884
Reaction score
449
Points
73
IMG_20180504_230211.JPG

Can anyone help me...In the b (iii) 2. part, shouldn't it be a negative sign between the two vertical components? The mark sheme says it's a positive one
Solving it with + between them gives a different answer which is also mathematically correct but the answer in the ms comes only with a negative sign
Plz helpppp:(
 
Messages
50
Reaction score
24
Points
18
Can someone please explain part (c)?
 

Attachments

  • Screenshot_20180506-034024.png
    Screenshot_20180506-034024.png
    198.1 KB · Views: 12
  • Screenshot_20180506-034054.png
    Screenshot_20180506-034054.png
    121.8 KB · Views: 11
Messages
50
Reaction score
24
Points
18
Can anyone tell me when to use which equation, like what are the situations or scenarios to use each equation. this is for SHM
Considering the statement given in bracket, maybe it has to do something with whether at t=0 the displacement is max or 0. Otherwise we can use any of these. Just that if there's a part in qs which requires an eq for velocity, we will use the derivative of the eq we used for displacement. Like if sin for x then cos of v
 
Messages
665
Reaction score
13,609
Points
503
Can anyone tell me when to use which equation, like what are the situations or scenarios to use each equation. this is for SHM
if the graph of displacement against time is starting from X0 i.e. the maximum displacement, then the one with coswt should be applied otherwise, sinwt should be used.
 
Messages
665
Reaction score
13,609
Points
503
Can someone please explain part (c)?
in c)i) draw the smoothed voltage graph as shown in our book...in it the voltage never drops to zero.
It's shape is more like that of a cloud.

for c) ii) the mean power INCREASES.
Since power = current x voltage
Just compare the graph you've drawn and the graph that's already given.
You don't need to consider the current cuz it stays constant.
What's the difference?
You see in the given graph the voltage drops to zero so the mean value is half of the peak value of voltage.
But your graph, the voltage never drops to zero so the mean must be way above half of peak value.
So the mean voltage or p.d. across resistor is increasing right?
And V is directly proportional to power.
So if voltage increases power must also increase.
 
Messages
50
Reaction score
24
Points
18
in c)i) draw the smoothed voltage graph as shown in our book...in it the voltage never drops to zero.
It's shape is more like that of a cloud.

for c) ii) the mean power INCREASES.
Since power = current x voltage
Just compare the graph you've drawn and the graph that's already given.
You don't need to consider the current cuz it stays constant.
What's the difference?
You see in the given graph the voltage drops to zero so the mean value is half of the peak value of voltage.
But your graph, the voltage never drops to zero so the mean must be way above half of peak value.
So the mean voltage or p.d. across resistor is increasing right?
And V is directly proportional to power.
So if voltage increases power must also increase.
Thank youuu so much!
Also in part 1 the ms say that Vmin should be at 4 V. Like ik how the shape should be but how do we find the Vmin the graph should fall to?
 
Messages
665
Reaction score
13,609
Points
503
Thank youuu so much!
Also in part 1 the ms say that Vmin should be at 4 V. Like ik how the shape should be but how do we find the Vmin the graph should fall to?
it says the variation is reduced to 1.6V.
So it should be like 5.6 to 4 to 5.6 to 4 again. The graph will have a variation of 5.6 -4 = 1.6V then.
 
Messages
75
Reaction score
48
Points
28
again with these graphs dont know how i should practice them :c, the only mistakes i'm making in the whole paper and like 70% worth of the paper is graphs lol.....
can someone explain why is it a negative gradient???? threshold frequency is the minimum frequency required to release an electron from the surface of a metal. is it negative gradient because the if wavelength increases then frequency decreases? and he ms also says concave curvature???? how would that look like???
also lol wtf do i do for the next part, i'm so oblivious in these types of questions.
 

Attachments

  • help 1.PNG
    help 1.PNG
    65.4 KB · Views: 10
Messages
665
Reaction score
13,609
Points
503
again with these graphs dont know how i should practice them :c, the only mistakes i'm making in the whole paper and like 70% worth of the paper is graphs lol.....
can someone explain why is it a negative gradient???? threshold frequency is the minimum frequency required to release an electron from the surface of a metal. is it negative gradient because the if wavelength increases then frequency increases? and he ms also says concave curvature???? how would that look like???
also lol wtf do i do for the next part, i'm so oblivious in these types of questions.
well just look at the equations.
For first graph...
E = hc/ λ so λ is inversely proportional to E so draw an inverse proportion graph.
For 2nd onw...
E = h/p so same inverse proportion.
the graph should be a curve with decreasing gradient.
 
Messages
75
Reaction score
48
Points
28
well just look at the equations.
For first graph...
E = hc/ λ so λ is inversely proportional to E so draw an inverse proportion graph.
For 2nd onw...
E = h/p so same inverse proportion.
the graph should be a curve with decreasing gradient.
assuming the first picture looks more like a curve.... is that correct?
also for the second part its the graph of
λ against momentum
since E proportional 1/λ
and E proportional 1/p
hence P directly proportional to λ hence a straight line???? Thats how i see it please correct lol.
 

Attachments

  • help 1.PNG.jpg
    help 1.PNG.jpg
    714 KB · Views: 5
Messages
665
Reaction score
13,609
Points
503
assuming the first picture looks more like a curve.... is that correct?
also for the second part its the graph of
λ against momentum
since E proportional 1/λ
and E proportional 1/p
hence P directly proportional to λ hence a straight line???? Thats how i see it please correct lol.
well the equation that ik of is of De Broglie's wavelength and that's λ = h/p
i havent studied anything abt E's proportion to p
 
Top