-
We need your support!
We are currently struggling to cover the operational costs of Xtremepapers, as a result we might have to shut this website down. Please donate if we have helped you and help make a difference in other students' lives!
Click here to Donate Now (View Announcement)
You are using an out of date browser. It may not display this or other websites correctly.
You should upgrade or use an alternative browser.
You should upgrade or use an alternative browser.
Physics paper 5 notes?
- Thread starter zack1090
- Start date
- Messages
- 1
- Reaction score
- 3
- Points
- 1
- Messages
- 124
- Reaction score
- 30
- Points
- 28
can any1 guide me how to calculate absolute errors in gradient and y intercept? alsoow to how to draw worst fit line in graph? plzz
- Messages
- 4,609
- Reaction score
- 3,903
- Points
- 323
Absolute error in gradient= gradient of best fit line- gradient of worst acceptable
absolute error in y intercept= (y intercept calculated using best fit line)- (Y intercept found using worst acceptable)
Tip- To find the y intercept
1. You will probably have the equation ordered in y=mX+C form
2. Substitute a coordinates for y and x in y=mx+c from best fit line for x and y and also the gradient of the best fin line and find C of best fit
3. Similarly find the y intercept of worst acceptable using a coordinate in WA and gradient of WA
4. the difference of the 2 intecpts give their absolute uncertinity
Good Luck and Best regards (SRI LANKA ROX)
thanks dude. and can you also tell something abut the s.f. in errors etc...... including the log errors..... how many s.f. do we have to write the errors in ?
thanks again
")
- Messages
- 124
- Reaction score
- 30
- Points
- 28
Absolute error in gradient= gradient of best fit line- gradient of worst acceptable
absolute error in y intercept= (y intercept calculated using best fit line)- (Y intercept found using worst acceptable)
Tip- To find the y intercept
1. You will probably have the equation ordered in y=mX+C form
2. Substitute a coordinates for y and x in y=mx+c from best fit line for x and y and also the gradient of the best fin line and find C of best fit
3. Similarly find the y intercept of worst acceptable using a coordinate in WA and gradient of WA
4. the difference of the 2 intecpts give their absolute uncertinity
Good Luck and Best regards (SRI LANKA ROX)
hey thaaank u soo much, and can u tel me or post picture of how to draw error bars like in quest 2 oct/nov 2009 p52?
- Messages
- 101
- Reaction score
- 39
- Points
- 38
Absolute error in gradient= gradient of best fit line- gradient of worst acceptable
absolute error in y intercept= (y intercept calculated using best fit line)- (Y intercept found using worst acceptable)
Tip- To find the y intercept
1. You will probably have the equation ordered in y=mX+C form
2. Substitute a coordinates for y and x in y=mx+c from best fit line for x and y and also the gradient of the best fin line and find C of best fit
3. Similarly find the y intercept of worst acceptable using a coordinate in WA and gradient of WA
4. the difference of the 2 intecpts give their absolute uncertinity
Good Luck and Best regards (SRI LANKA ROX)
I am also from srilanka
which skul r u from ?- Messages
- 124
- Reaction score
- 30
- Points
- 28
any1 tel me how to do quest 2 part c in http://papers.xtremepapers.com/CIE/...and AS Level/Physics (9702)/9702_s09_qp_5.pdf
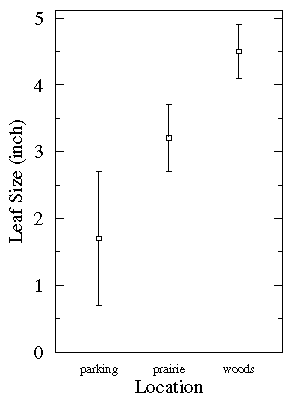
Suppose your uncertainty is .007 for .123 value of t^2 and according to the scale of y-axis one small square is equal to (.12-.10)/10= .002.So u divide .007 by .002=3.5.Now u draw a vertical line from the point of .123 covering 3.5 block in upward and downward direction.And where that vertical line finishes u draw a small (almost of the size of smallest square of the graph)horizontal line to show its limits both upward and downwards.hey thaaank u soo much, and can u tel me or post picture of how to draw error bars like in quest 2 oct/nov 2009 p52?
Its not the graph of the A level question but give u rough idea of how a error bar looks.
- Messages
- 124
- Reaction score
- 30
- Points
- 28
Suppose your uncertainty is .007 for .123 value of t^2 and according to the scale of y-axis one small square is equal to (.12-.10)/10= .002.So u divide .007 by .002=3.5.Now u draw a vertical line from the point of .123 covering 3.5 block in upward and downward direction.And where that vertical line finishes u draw a small (almost of the size of smallest square of the graph)horizontal line to show its limits both upward and downwards.
Its not the graph of the A level question but give u rough idea of how a error bar looks.
oh thaaaaank u soo much, great ambiguity cleared, llike in(0.12+- 0.006) if 1 ssmall box = 0.002 then we will draw error bars covering 3 boxes right?
god bless you!
Yes 3 box vertically up and downwards also.oh thaaaaank u soo much, great ambiguity cleared, llike in(0.12+- 0.006) if 1 ssmall box = 0.002 then we will draw error bars covering 3 boxes right?
god bless you!
Always glad to help.
- Messages
- 124
- Reaction score
- 30
- Points
- 28
oh thaaaaank u soo much, great ambiguity cleared, llike in(0.12+- 0.006) if 1 ssmall box = 0.002 then we will draw error bars covering 3 boxes right?
god bless you!
is my graph and error bars correct?Attachments
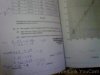
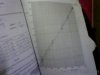
The pic is to blur to see where the worst fit is joining the top error bar.is my graph and error bars correct?
Read my comment# 86 https://www.xtremepapers.com/community/threads/physics-paper-5-tips.12941/page-5is my graph and error bars correct?
- Messages
- 4,609
- Reaction score
- 3,903
- Points
- 323
can anybody please fill out the errors section in this paper's question 2 so that i can match ...... MS doesnt give the error values :\ :|
http://papers.xtremepapers.com/CIE/...nd AS Level/Physics (9702)/9702_w11_qp_52.pdf
thank you
http://papers.xtremepapers.com/CIE/...nd AS Level/Physics (9702)/9702_w11_qp_52.pdf
thank you
- Messages
- 115
- Reaction score
- 42
- Points
- 38
i dont even know how do we calculate this error bars ._.
can anybody please fill out the errors section in this paper's question 2 so that i can match ...... MS doesnt give the error values :\ :|
http://papers.xtremepapers.com/CIE/...nd AS Level/Physics (9702)/9702_w11_qp_52.pdf
thank you
Hey SIS,
I cant read your values. Please can you upload a better picture.
It seems that you error bars is okay.
Here are some tips
1- always draw your graphs using a very fine pencil ie Sharpen your pencil when plotting a graph)
2- Don't just limit your graph to fist and last point, extend it
3- i was amazed to hear that the line of best fit don't necessarily have to pass through all the point BUT should have an even spread. That is equal number of points on either side of the graph.
PS - your WA line is no clear Please see my diagram
HOPE all this will be help ful to you,
Posted by a proud lankan lion
In the second error bar u posted which is blue u showed that it was a little small than the red error bar. So if our worst fit line is opposite that is from the bottom part of the top error bar to the top part of the bottom error bar then the value of error bar will remain same right in both cases?
- Messages
- 124
- Reaction score
- 30
- Points
- 28
Hey SIS,
I cant read your values. Please can you upload a better picture.
It seems that you error bars is okay.
Here are some tips
1- always draw your graphs using a very fine pencil ie Sharpen your pencil when plotting a graph)
2- Don't just limit your graph to fist and last point, extend it
3- i was amazed to hear that the line of best fit don't necessarily have to pass through all the point BUT should have an even spread. That is equal number of points on either side of the graph.
PS - your WA line is no clear Please see my diagram
HOPE all this will be help ful to you,
Posted by a proud lankan lion
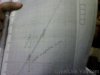
ohh ok, i wil try to post better one.. and thaaaak u so much for sharing your pic, actually i had ambiguity wether my WA line is correct or not now atleast i got idea and question demands that WA line should pass through all error bars so i didnt understood this , i am posting anothesser pic plz rectify me if WA line passes all error bars thaanks.. god bless
Attachments
- Messages
- 124
- Reaction score
- 30
- Points
- 28
fb.junks can u tel me how to calculate uncertainities in y intercept and in constants? also how to determine y intercept as in paper http://papers.xtremepapers.com/CIE/...nd AS Level/Physics (9702)/9702_s12_qp_51.pdf ? my both WA and best fit intercept is 0
fb.junks can u tel me how to calculate uncertainities in y intercept and in constants? also how to determine y intercept as in paper http://papers.xtremepapers.com/CIE/Cambridge International A and AS Level/Physics (9702)/9702_s12_qp_51.pdf ? my both WA and best fit intercept is 0
use the formula y=mx+c . c is y-intercept. first use the gradient and x and y values f best fit line gradient. Then do it with the worst fit line gradient. The y intercept of the best fit line gradient is the answer and the error will be the difference between the 2 y intercepts.
- Messages
- 124
- Reaction score
- 30
- Points
- 28
use the formula y=mx+c . c is y-intercept. first use the gradient and x and y values f best fit line gradient. Then do it with the worst fit line gradient. The y intercept of the best fit line gradient is the answer and the error will be the difference between the 2 y intercepts.
oh ok and which a and y values we need to take for WA line? and plz tel me how to calculyae uncertainities of constants or tel me part d of same paper plz? thaanks