can u explain.
May be if I revise the topic I can.
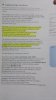
We are currently struggling to cover the operational costs of Xtremepapers, as a result we might have to shut this website down. Please donate if we have helped you and help make a difference in other students' lives!
Click here to Donate Now (View Announcement)
can u explain.
yeah^ why not b?
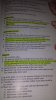
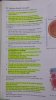
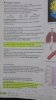
can somebody please explain me this diagram.. its about the nitrogen cycleView attachment 51384
") Get on with the other topic in the meantime i upload
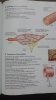
Get on with the other topic in the meantime i upload You know bcos they said that it was sprayed on leaf. Therefore, it would get in phloem and not in xylem bcos xylem comes from roots...
Ok i will give you my notes they are quite simplified...
xX Love n Good Luck xX


So what? leaves have xylem vessels as well as phloem sieve tubes, and the spray is dissolved in water so it should go through xylem,no? :/You know bcos they said that it was sprayed on leaf. Therefore, it would get in phloem and not in xylem bcos xylem comes from roots...
. 
I think I will save theses as well will help later I'm sure. :3
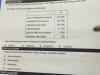
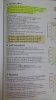
Well, your question says 'Diastole' , but I will break it up and that will make it a lot easier for you to get it!What is the period of diastole in this diagram... I feel its the region "A and C" please tell me whether i'm right or wrong.. explainations will be appreciated
Biology revision guide says its region "D"Well, your question says 'Diastole' , but I will break it up and that will make it a lot easier for you to get it!
First of all, it starts with the atrial systole right? So that is from zero seconds till before 2s, the curve falls down marking that the atrial systole ended, but the curve for the left ventricle rises during A marking the beginning of the ventricular systole therefore A is not diastole. Once the curve starts falling down at B, this marks that the pressure in the left ventricle is decreasing marking that the systole ended and the ventricular diastole started. C and D you have no contraction whatsoever.
Therefore to sum up, Atrial diastole from half of A (0.1) till the end.
Ventricular diastole, 0-0.1 then 0.4-0.8, and so together they make the diastole that is from 0.4-0.8.


Dude you are confusing yourself, your graph has 2 atrial systoles which is incorrect, you have only one atrial systole per cardiac cycle. The answer C is the correct one. The picture has all the explanation you need to know, May/June 2014 paper 22 last question has the timing thing. With those, I guess you will understand it.Biology revision guide says its region "D"
View attachment 51503
View attachment 51504
but then comes the contradiction in the ans of this question
According to the revision guide the answer should be "D" but the ans of this question in mark scheme says the ans is "C'.... so confused about it
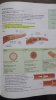
can u give more of this chapter notes here ?Dude
Dude you are confusing yourself, your graph has 2 atrial systoles which is incorrect, you have only one atrial systole per cardiac cycle. The answer C is the correct one. The picture has all the explanation you need to know, May/June 2014 paper 22 last question has the timing thing. With those, I guess you will understand it.
The question says AV valves and SL valves have to be closed, and the total time, which will be from 2-1(arrows on the graph) and from 4-3(on the graph too).
Here you go!can u give more of this chapter notes here ?
For almost 10 years, the site XtremePapers has been trying very hard to serve its users.
However, we are now struggling to cover its operational costs due to unforeseen circumstances. If we helped you in any way, kindly contribute and be the part of this effort. No act of kindness, no matter how small, is ever wasted.
Click here to Donate Now